


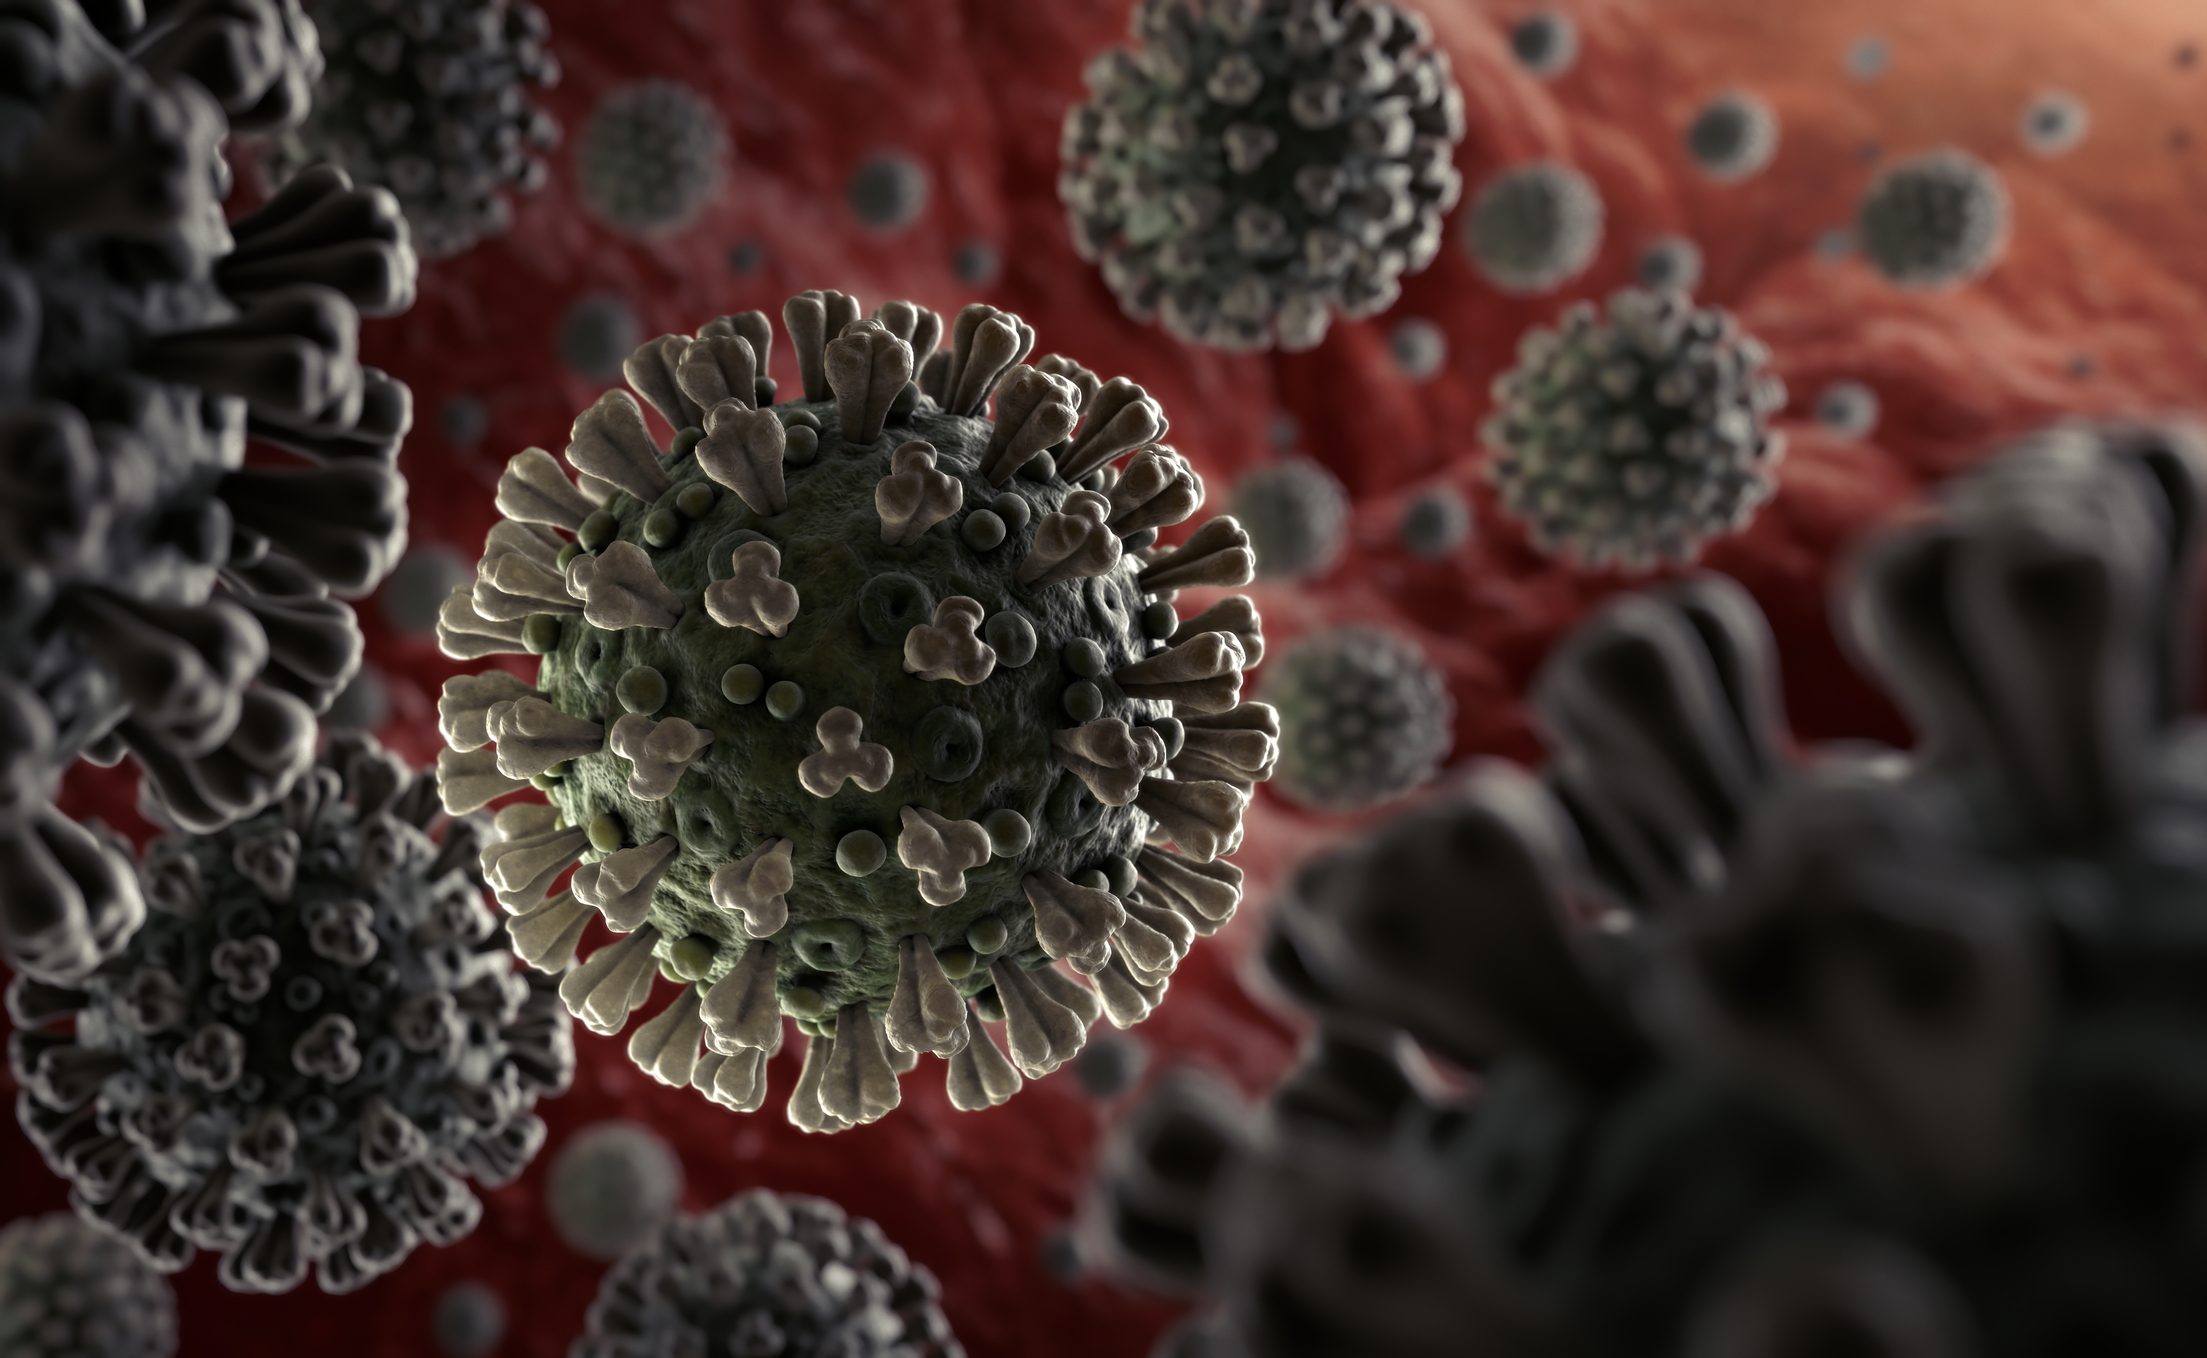
On December 31, 2019, an outbreak of “pneumonia-like respiratory illness” was found in Wuhan City, Hubei Province. It is the seventh-largest city in China with over 11 million residents. Later, WHO discovered it as Novel Coronavirus (Coronavirus disease 2019, COVID – 19) which affects the function of the internal organs such as Respiratory system and Renal failure, etc. Geographical Information System (GIS) is used to track the spread of the disease across the world. Let’s find out how GIS is utilized in this Public health crisis.
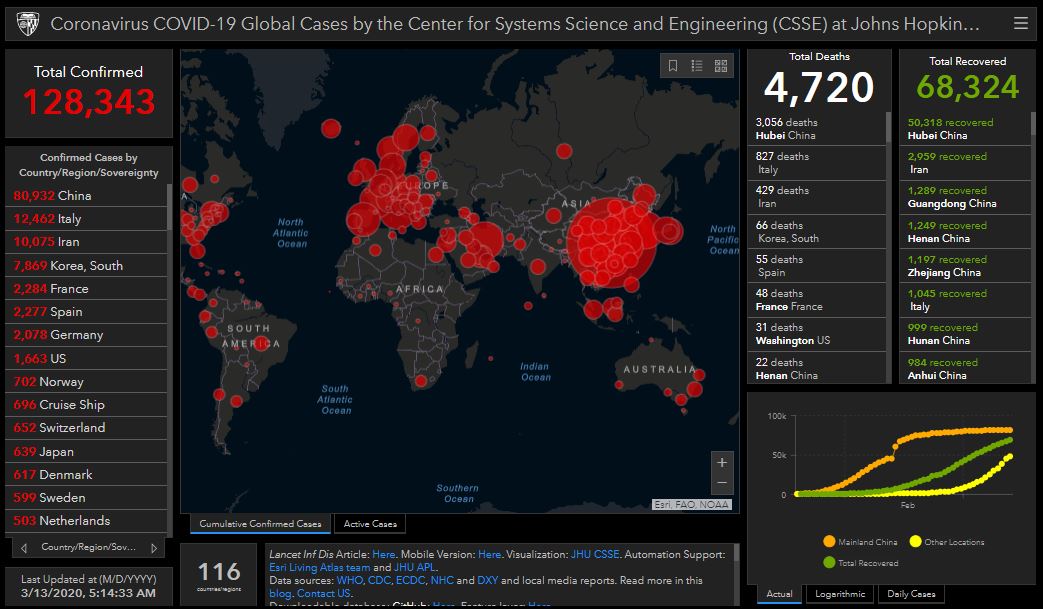
According to the World Health Organisation, Corona Virus has spread over 114 countries. More than 4,700 people have died from COVID-19 while 128,300 cases have reported infected(As of 13, March 2020).
The World Health Organization (WHO) declared the Coronavirus outbreak, a pandemic. It has been suspected that the virus will likely spread and will worsen all across the globe. ” We expect to see the number of cases, the number of deaths, and the number of affected countries climb even higher.” Says the Director-General of WHO, Tedros Adhanom Ghebreyesus.
.@WHO is deeply concerned by the alarming levels of the #coronavirus spread, severity & inaction, & expects to see the number of cases, deaths & affected countries climb even higher. Therefore, we made the assessment that #COVID19 can be characterized as a pandemic. https://t.co/97XSmyigME pic.twitter.com/gSqFm947D8
— Tedros Adhanom Ghebreyesus (@DrTedros) March 11, 2020
His recent Tweet on March 12, 2020, “#COVID19 is a controllable pandemic. Countries that decide to give up on fundamental public health measures (like case finding and contact tracing) may end up with a larger problem, and a heavier burden on the health system that requires more severe measures to control.”
Mapping The Novel Coronavirus Outbreak with GIS
As the new Coronavirus has spread around the world, many people are relying on online maps to understand the real-time status of the Coronavirus outbreak. Researchers at John Hopkins Unversity has used GIS technology to create an interactive dashboard with a map, charts and numerical data to access the confirmed cases over each country. And this Spread of coronavirus crisis isn’t the first time that uses mapping to track the spread of disease. It all started with the map of the cholera outbreak in the 1850s in London.
How GIS is used in the Coronavirus (COVID-19) Outbreak?
Geographical Information Systems (GIS) is a software that has transformed the map-making. It is used to create maps for any given phenomenon. Maps are making it an easier way to present complex information. The map pulls the information from various range of sources for real-time updates.
It is mostly useful for studying the geographical pattern used for collecting, integrating and analyzing the spatial data from various themes. The collected data is combined as a new set of data that drives solutions for complex problems. There are two branches in geography, Human Geography which examines the spatial aspects of human behaviors and another one is Physical Geography which studies the pattern of climate, vegetation, landforms.
Here, GIS bridges the two phenomena into one platform to map the disease patterns of relationships with the social, institutional and natural environment, commonly known as Public health data mapping. Today, we use this method for visualizing the overall disease-affected areas, finding where it started and how it is spreading across the world. And also how to rescue uninfected people from the disease prevalence zones, delivering the perfect pandemic statistics to the public properly.
Many methods are available to mapping the outbreaks of the virus such as overlay analysis, hotspot analysis, statistical analysis, and web – GIS.
Overlay Analysis
Various kinds of data are combined together, and the weightage of each factor is given according to the priority of the crisis in a particular state. It is a commonly used medical research team to find the association between the prevalence of disease and specific features or environments.
Hot spot / Proximity Analysis
This helps to take immediate action for the rescue operation. If the hospital or health center lies 5km or 2km from the infected area, then users have to specify a buffer of 2km according to the distance from the point of spreading with disease-infected data to map impact zone to strengthen the control activities.
Network Analysis
The data of the Road/street network, traffic, mobile, disease infected areas are primary data used in this analysis. By analyzing the transportation pattern and traffic details, find an effective route to transfer an infected person to a hospital or health center from a Zone.
Statistical Analysis
Specific calculations also can be done by GIS, for example: To know the population in the affected areas, mortality rate, distance from the health center. These analyses are done with acquired data which can also be used for further study.
Web – GIS
One of the recent advancement in GIS is web-based GIS, here we can store all health-related data in a central server that can be accessed from various points through an internet server. It helps to pass the information instantly across the world. Also, maps published on this web allows patients to easily connect with the health services from their home/workplace.
How you can Track COVID-19 in Real-time?
Center for Systems Science and Engineering (CSSE) at Johns Hopkins University developed the interactive web-based dashboard to visualize and track the reported cases. It was officially released to the public on January 22.
Here we will see some of the maps that will help you track real-time data on COVID-19. These maps illustrate the locations, number of reported or confirmed cases, deaths, recoveries around the world. The key purpose of these maps is to bring information about the spread of the Novel Coronavirus -COVID-19 to researchers as well as to the public to have a better understanding of the pandemic. All the data displayed in this dashboard is freely available in google sheet initially, now also in GitHub repository.
We have listed down the credible dashboards where your track the Novel Coronavirus outbreak for a comprehensive overview of the real-time data.
- Coronavirus COVID-19 Global Cases – John Hopkins University (JHU)
- Novel Coronavirus(COVID-19) Situation – WHO
- Total Confirmation of Wuhan Coronavirus case
- COVID-19 Coronavirus outbreak – WorldOmeter
- List of Novel Coronavirus Dashboards for different countries
Preventive Measures
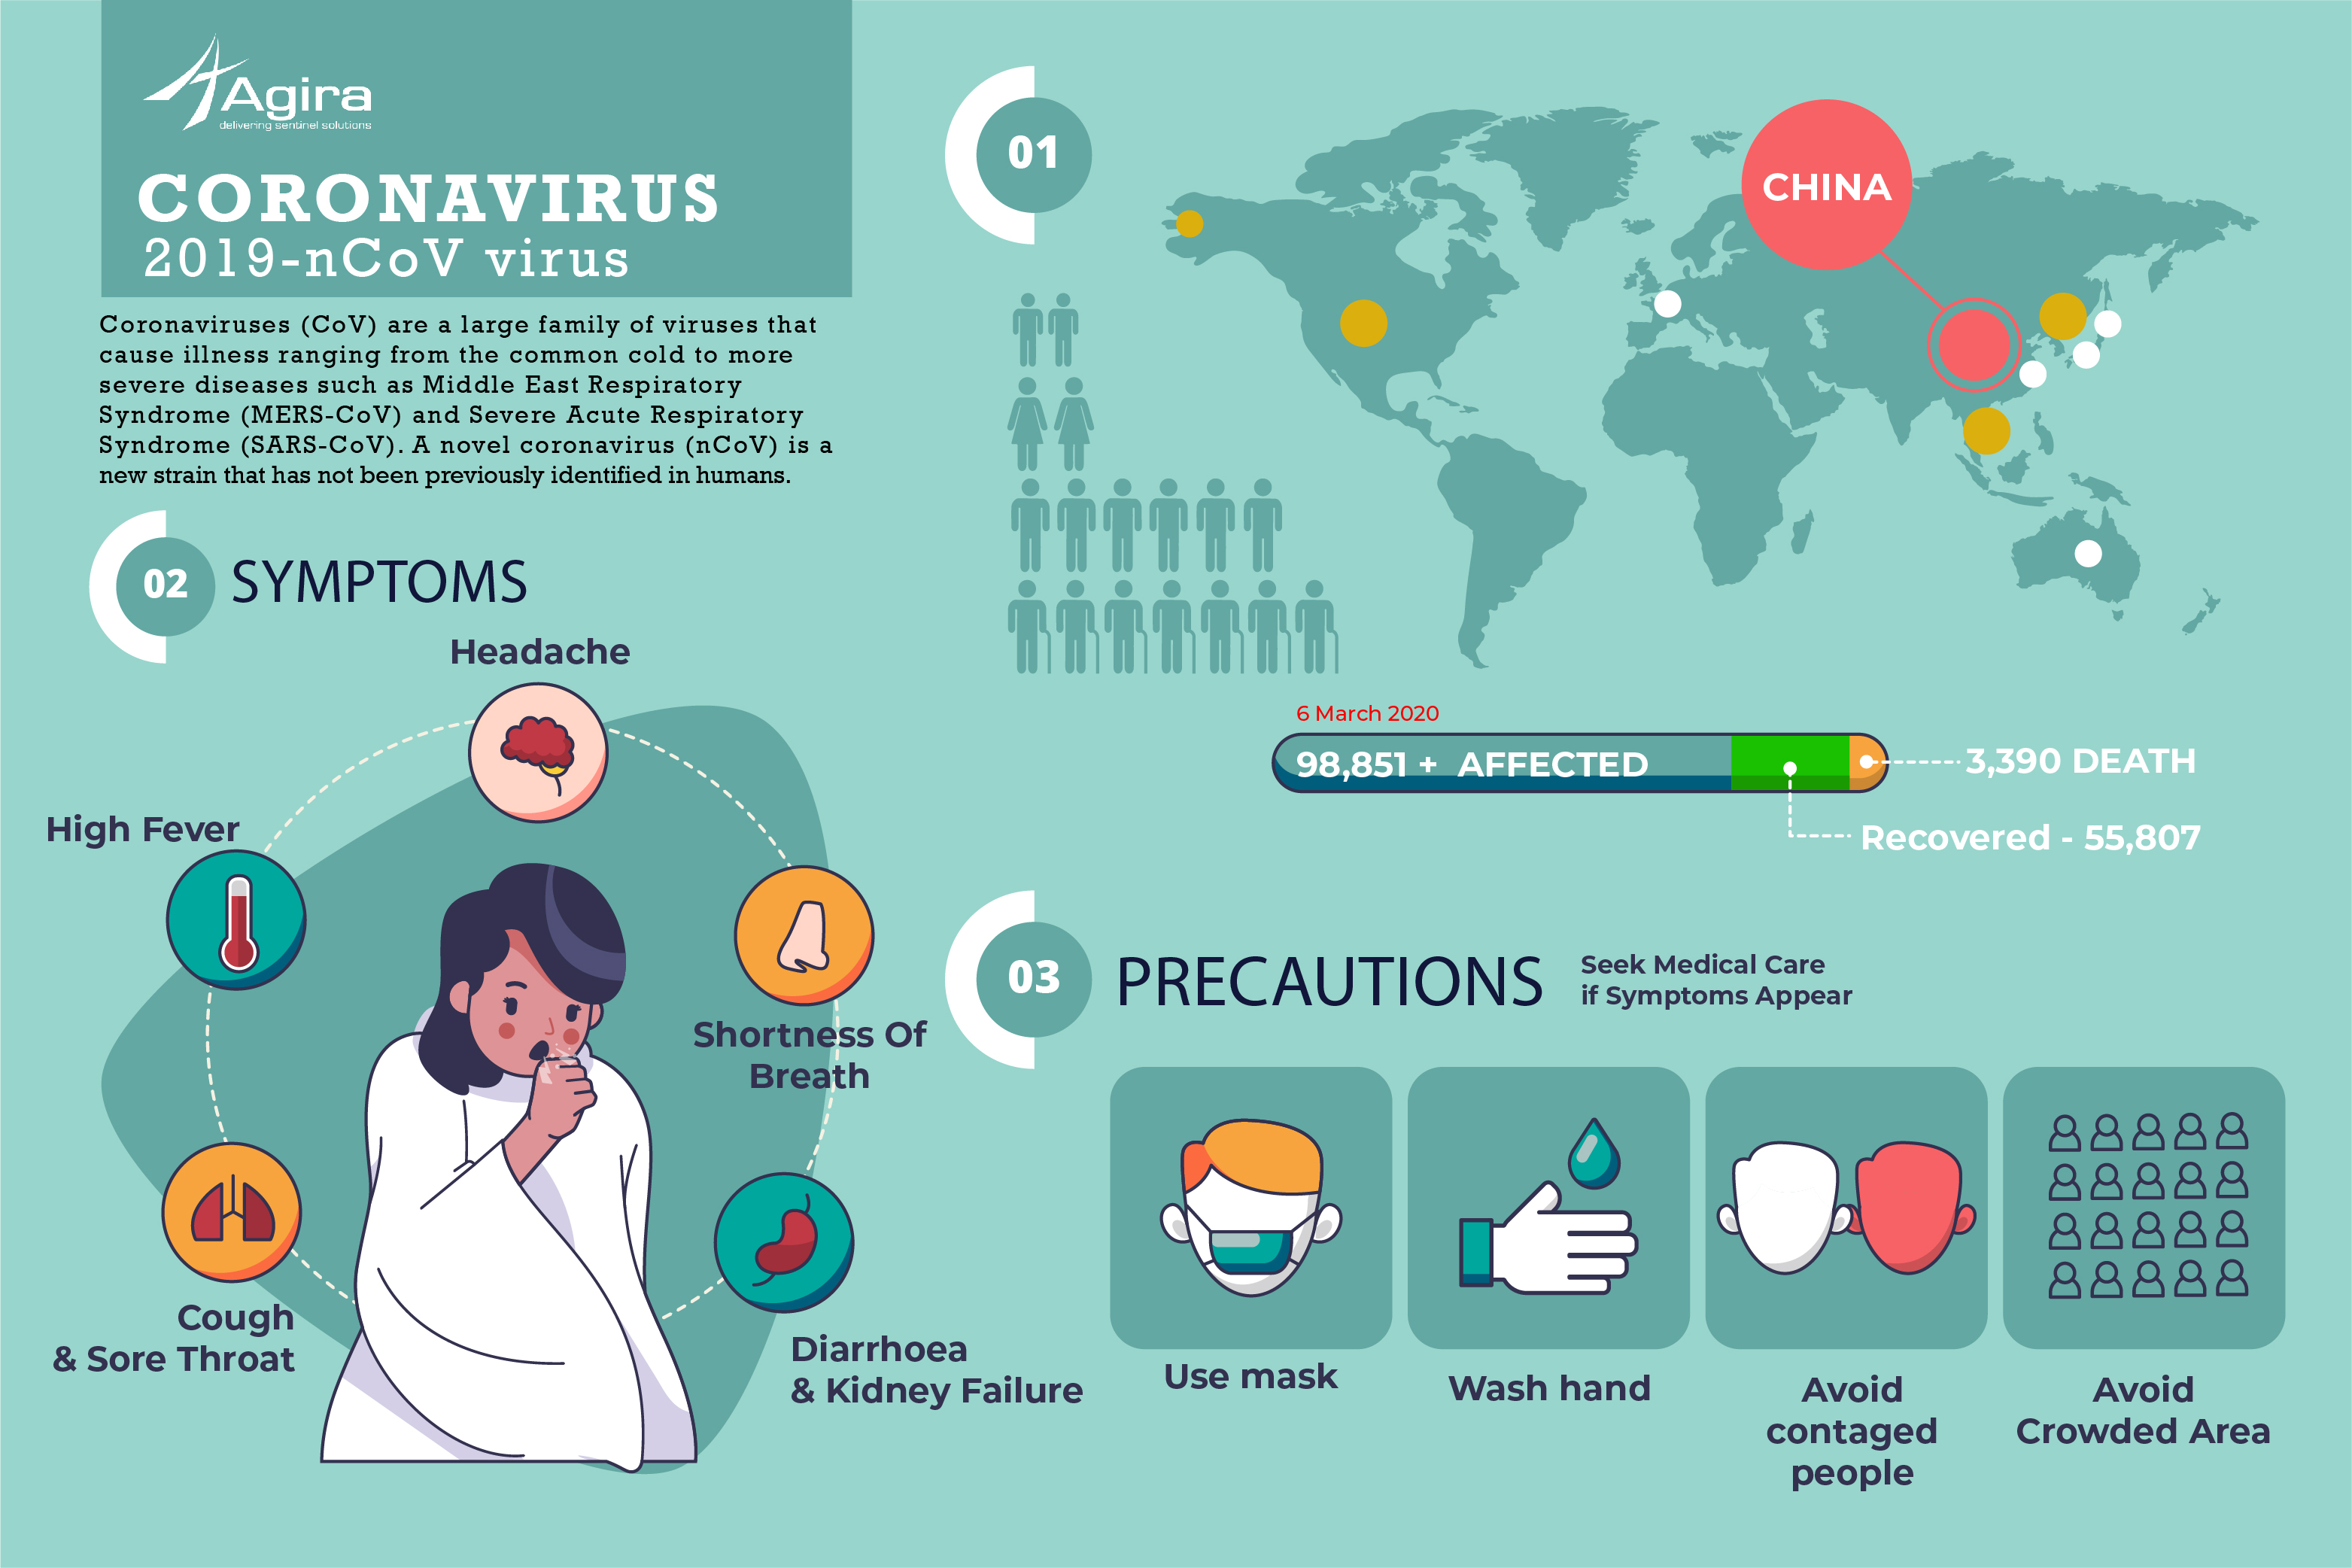
Coronavirus – COVID-19 are zoonotic, meaning that they can be easily transmitted from animals to humans and humans to humans which causes common cold to severe respiratory illness. Medical researches are going on to find the host of the virus and to find a cure. The symptoms will appear 2-14 days after exposure. There is no specific treatment for COVID-19, but symptoms of the virus can be treated. Based on the symptoms you have to contact the state medical emergency for guidance and treatment.
Common signs of COVID-19 Infection
- Cough
- Fever
- Difficulties in breathing
- Headache, sore throat, fatigue
- In severe cases, Pneumonia, kidney failure, severe acute respiratory syndrome.
Risk of Coronavirus Infection & Remedial Measures
- Avoid journey to places where the infection is high
- Wash your hands properly for at least 20 seconds, Use alcohol-based hand sanitizers
- Avoid close contact with people who may or may not infected
- Use a tissue while you cough or sneeze. Use bent elbow while coughing if you don’t have a tissue
- Avoid crowded places to reduce direct contact with humans or pets
As quarantine is the best solution to stop the spread of the COVID-19, Drone, a high tech surveillance tool is used for data collection, awareness as well as prevention. In China and many other countries are using Drones for crowd monitoring and fever detection by flying over the vehicles at checkpoints.